This is an old revision of the document!
Magic Lantern RAW based exposure feedback
Magic Lantern contains a number of exposure feedback features, based from raw data. This is very beneficial, as regular Canon exposure feedback is subject to picture style, and other JPG based processing.
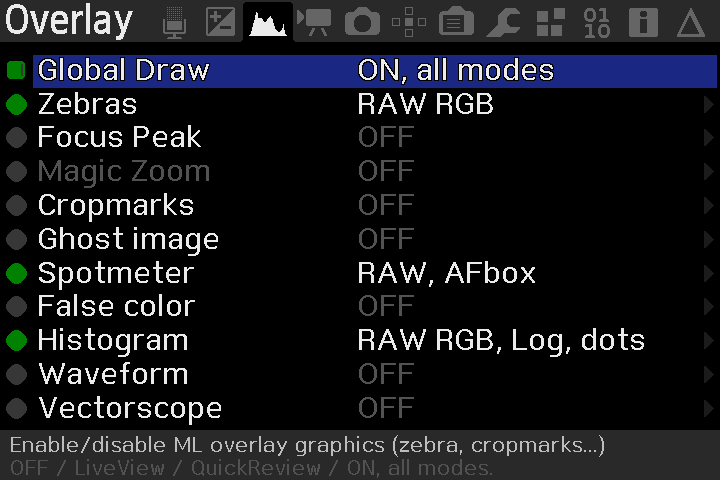 These features can be found in the Overlay menu. See image →
They work in both Movie mode and Photo mode Live View, and in the Quick Image review.
In Movie mode Live View, you must load one of the raw recording modules and have it activated for raw based exposure feedback to function. In Photo mode (Live View or not), picture quality must be set to raw in Canon menu, and in Photo mode Live View, ExpSim must be enabled.
Spotmeter

The spotmeter is a tool used to meter a particular area of the scene. For instance, you may want to meter a particular area of your scene, as a highlight, a midtone, or whatever. The raw based spotmeter in ML works in EV Exposure Value units, and represents the EV from saturation (overexposure).
Below is a teddy bear, showing the midtone patch metered for a midtone, checking the white level at this metering, and then after Exposing to the Right.


Histogram
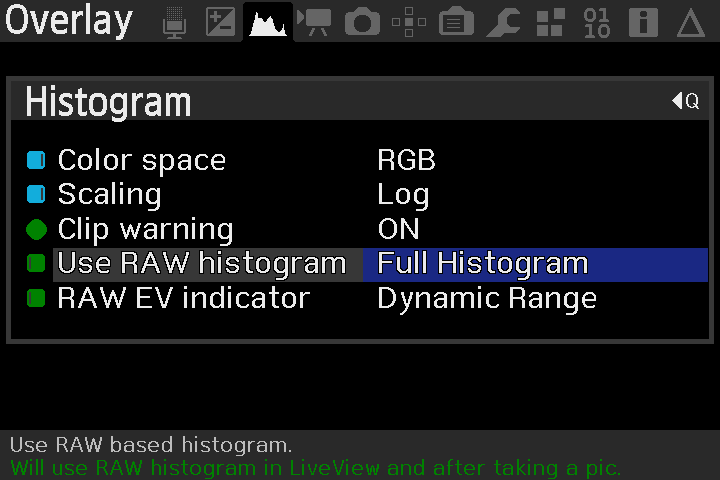
The histogram provides a graphical representation of the exposure of the entire scene.

The colors in the histogram, represent the color channel in the camera (Red, Green, Blue). You will also notice, that ML displays Cyan, Magenta and Yellow. If you look at the color chart below, you can see that Yellow falls in between Green and Red, and hence, Yellow represents data in both the Green and Red channels. Cyan being the data from Green and Blue channels, and Magenta being the data from Blue and Red channels. White indicates data from all color channels.
The white vertical lines at the rear of the histogram display, represent full stop EV. So the very right hand side of the histogram represents overexposure. The first line from the right hand side, represents 1 EV (a full stop) from overexposure, the next line is another 1 EV (2 EV total) from overexposure, and so on.

When the scene contains overexposure, the histogram will provide warnings.

The colored circles in the histogram, warn of overexposure in the color channel 1). Small circles show a very small amount of exposure, with the circles increasing in size. When at least 1 % of the pixels of a channel are overexposed, the numbers inside these colored circles, describe the percentage of pixels that have been overexposed in that color channel. In the above example. 1% of red pixels have been overexposed, 10% of green pixels and 2% of Blue pixels.
[hr]
The histogram in ML also contains [url=http://en.wikipedia.org/wiki/Exposing_to_the_right]Exposure to the Right[/url] information. This feedback show the user how far they can Expose to the Right before overexposing.
[img width=300]https://s1.postimg.cc/4xiuykuycf/ETTR_hint.png[/img]
![https://s1.postimg.cc/4xiuykuycf/ETTR_hint.png[/img]](https://s1.postimg.cc/4xiuykuycf/ETTR_hint.png[/img])
Take this scene metered with Canon Av mode. [img width=400]https://s1.postimg.cc/5movwricfj/Under.jpg[/img]
![https://s1.postimg.cc/5movwricfj/Under.jpg[/img]](https://s1.postimg.cc/5movwricfj/Under.jpg[/img])
Here we are being given feedback that suggests we can push the exposure 1.5 EV (stops) before overexposure. And in the two images below, on the left hand side, the scene has been Exposed to the Right, and on the right hand side, the scene has been overexposed.
[img width=400]https://s1.postimg.cc/8z7lr4oeov/ETTR.jpg[/img] [img width=400]https://s1.postimg.cc/64exlcg2u7/Over.jpg[/img]
![https://s1.postimg.cc/8z7lr4oeov/ETTR.jpg[/img]](https://s1.postimg.cc/8z7lr4oeov/ETTR.jpg[/img])
![https://s1.postimg.cc/64exlcg2u7/Over.jpg[/img]](https://s1.postimg.cc/64exlcg2u7/Over.jpg[/img])
[color=red]Note:[/color] Due to inconsistencies in the original firmware design, determining the correct overexposure point is extremely difficult. You should be very wary when the histogram reads from -0.4EV through to (slight) overexposure. There may be some slight overexposure when none is reported, or vice-versa, there may be no overexposure even though some has been reported. If you know the true saturation value for your sensor at the shot settings, you may wish to use [url=https://builds.magiclantern.fm/modules.html#raw_diag]raw_diag[/url] if you like to nitpick.
Otherwise, to be certain of no overexposure, target a ETTR hint > -0.4EV.
[url=http://www.magiclantern.fm/forum/index.php?topic=20579.msg192432#msg192432]Further discussion.[/url]
[hr]
The histogram in ML also contains [url=http://en.wikipedia.org/wiki/Dynamic_range]Dynamic Range[/url] feedback. This describes the ratio between the reported white level, and the [url=http://en.wikipedia.org/wiki/Noise_floor]Noise Floor[/url] of the camera, and is only very accurate when the image contains overexposed pixels.
[img width=300]https://s1.postimg.cc/5f8wn5utwv/DR_hint.png[/img]
![https://s1.postimg.cc/5f8wn5utwv/DR_hint.png[/img]](https://s1.postimg.cc/5f8wn5utwv/DR_hint.png[/img])
[img width=400]https://s1.postimg.cc/67ls4wdd33/Histo_DR.jpg[/img]
![https://s1.postimg.cc/67ls4wdd33/Histo_DR.jpg[/img]](https://s1.postimg.cc/67ls4wdd33/Histo_DR.jpg[/img])
Note: The brown area in the histogram represents this noise floor.
[hr]
[anchor=Histobar][color=green][u][size=14pt][b]Simplified Histobar[/b][/size][/u][/color][/anchor]
For LiveView work, there is also the Simplified Histobar.
[img width=300]https://s1.postimg.cc/9gxnfpuab3/Histobar.png[/img]
![https://s1.postimg.cc/9gxnfpuab3/Histobar.png[/img]](https://s1.postimg.cc/9gxnfpuab3/Histobar.png[/img])
The Histobar is shown here at the top left of the liveview screen.
[img width=400]https://s1.postimg.cc/8s4dvpcbwv/Histobar1.png[/img]
![https://s1.postimg.cc/8s4dvpcbwv/Histobar1.png[/img]](https://s1.postimg.cc/8s4dvpcbwv/Histobar1.png[/img])
Red indicates overexposure, blue indicates extreme underexposure, and the yellow bar represents the midpoint. The blue bar increases in size with increasing underexposure. So the image above shows a small amount of the scene is extremely underexposed, and a full bar would indicate a large amount of the scene is extremely underexposed.
The midtone point is the median of the scene. For further information, see [url=http://www.magiclantern.fm/forum/index.php?topic=8539.msg80044#msg80044]this post[/url] by a1ex.
[hr]
[anchor=Zebras][color=green][u][size=14pt][b]Zebras[/b][/size][/u][/color][/anchor]
[img width=300]https://s1.postimg.cc/6ggsz6eh5r/Zebras.png[/img]
![https://s1.postimg.cc/6ggsz6eh5r/Zebras.png[/img]](https://s1.postimg.cc/6ggsz6eh5r/Zebras.png[/img])
Zebras provide a graphical overlay of the areas in the scene which are overexposed, and underexposed.
[img width=360]https://s1.postimg.cc/1htaknr6en/Zebra1.png[/img] [img]https://s1.postimg.cc/2dd0lxt9zz/97pwi.gif[/img]
![https://s1.postimg.cc/1htaknr6en/Zebra1.png[/img]](https://s1.postimg.cc/1htaknr6en/Zebra1.png[/img])
![https://s1.postimg.cc/2dd0lxt9zz/97pwi.gif[/img]](https://s1.postimg.cc/2dd0lxt9zz/97pwi.gif[/img])
And a scene showing zebras/histogram, with overexposure, and underexposure.
[img width=400]https://s1.postimg.cc/96atmkc24v/Histo_Zebras.jpg[/img]
![https://s1.postimg.cc/96atmkc24v/Histo_Zebras.jpg[/img]](https://s1.postimg.cc/96atmkc24v/Histo_Zebras.jpg[/img])
As with the histogram, the color displayed by the zebras, represent the color channel in the camera that is overexposed. Again, a Cyan reading is describing overexposure in both the Green, and the Blue channels, Yellow describing both Green and Red channels, and Magenta describing both Red and Blue channels.
Unlike the histogram, black describes overexposure in all color channels, and white describes underexposure. [s]This underexposure point describes any data that is within 1 EV of the camera noise floor[/s].
Update: dmilligan added some underexposure adjustment to the zebras. [img width=400]https://s1.postimg.cc/9b9h4ytg7j/Zebra_under.png[/img]
![https://s1.postimg.cc/9b9h4ytg7j/Zebra_under.png[/img]](https://s1.postimg.cc/9b9h4ytg7j/Zebra_under.png[/img])
This allows you to choose at what exposure the underexposure zebras will be displayed. 0 EV means that the zebras will be displayed where the amount of noise in the image, is equal to the amount of signal in the image (the noise floor). A general consensus amongst photographers, is that the limit for acceptable amount of noise in images, is 2 EV above this noise floor.
[hr]
[anchor=dualzebras][color=green][size=14pt][u][b]Dual ISO Zebras[/b][/u][/size][/color]
When using [url=http://www.magiclantern.fm/forum/index.php?topic=7139.0]dual ISO[/url], there are dual exposures and the zebras reflect this. With dual ISO there are two types of zebras. Full/solid zebras which work exactly like normal zebras, and describe [i]overexposure in both ISOs[/i]. And half/stripe zebras which represent [i]overexposure only in the higher ISO[/i].
Looking at this image below from DeafEyeJedi, we can see there are solid zebras (black/yellow/green) in the lamp shade, and solid zebras (green/cyan) on the laptop screen.
[img width=400]https://s1.postimg.cc/3uvx1v44q7/Full_Zebras.png[/img]
![https://s1.postimg.cc/3uvx1v44q7/Full_Zebras.png[/img]](https://s1.postimg.cc/3uvx1v44q7/Full_Zebras.png[/img])
So both ISOs being used in dual ISO have been overexposed in these areas. The other stripe zebras are showing where only the higher ISO has been overexposed, in this case, blue, yellow and green on the wall behind.
The image below shows the same scene with only the higher ISO being overexposed, and only half/stripe zebras being displayed.
[img width=400]https://s1.postimg.cc/4clyqfzpz3/Half_Zebras.png[/img]
![https://s1.postimg.cc/4clyqfzpz3/Half_Zebras.png[/img]](https://s1.postimg.cc/4clyqfzpz3/Half_Zebras.png[/img])
[hr]
[anchor=JPG][color=green][size=14pt][u][b]RAW vs JPG[/b][/u][/size][/color]
So, what's the big deal with raw based feedback. JPG processing is designed simply to produce good looking images directly from the camera. Since all of the Canon exposure feedback is based from this JPG processing (even when shooting raw), it suffers from inaccuracy. Raw data is not affected by picture style, white balance, or any other JPG based processing. So when using raw data for exposure feedback, we have a very accurate representation of the actual raw data.
As an example, here is a scene showing the accuracy differences.
The image on the left is showing Canon exposure feedback, and the image on the right is the raw histogram from Magic Lantern. [img width=400]https://s1.postimg.cc/7zridyrnkv/JPG2.jpg[/img] [img width=400]https://s1.postimg.cc/3nsp6f4h6n/JPG1.jpg[/img]
![https://s1.postimg.cc/7zridyrnkv/JPG2.jpg[/img]](https://s1.postimg.cc/7zridyrnkv/JPG2.jpg[/img])
![https://s1.postimg.cc/3nsp6f4h6n/JPG1.jpg[/img]](https://s1.postimg.cc/3nsp6f4h6n/JPG1.jpg[/img])
Notice how the Canon histogram is showing a large amount of overexposure in the red channel. However, the actual raw data still contains some slight headroom.